There are two broad categories that investment managers typically assess when deciding to buy or sell a particular security: 1) The Fundamentals – i.e., How strong or weak is the economy? How strong or weak are the financials of a company? 2) The Technicals – i.e., Has the price of a particular index or stock moved above or below certain trend lines or thresholds?
I use quite a few technical indicators in my investment approach because “price never lies” – that is, if the price is going down, it’s going down, subjecting clients to the potential for wealth destruction.
However, there are hundreds, if not thousands, of technical indicators that can be assessed, making this business incredibly challenging to filter through the noise and figure out those that are potentially the most impactful.
In August, we had a “death cross” in the S&P 500 Index, among others. What is the “death cross?” Is it one of the more meaningful technical indicators? And what are the potential implications for the stock market?
Many money managers look at the 50 day moving average* crossing the 200 day moving average* (somewhat dramatically called “the death cross”) of the S&P 500 Index to determine the overall stock market trend. If such an event occurs, some investors believe that there is a higher probability of entering a bear market. (A bear market is often defined as an asset class being down -20%.)
While I don’t use this indicator in the buy and sell decisions for my client portfolios, I do track the “death cross” because this type of action may imply a change in price trend in the security or index being analyzed.
Take a look at the illustration below of the S&P 500 Index, its 50 day moving average (blue line), and its 200 day moving average (orange line):
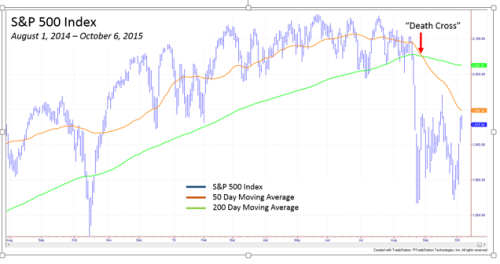
As you can see, the “death cross” occurred in August, with a significant pickup in volatility over the quarter.
We will get to the potential implications of this below, but before doing so, let’s review where the major asset classes closed at the end of the third quarter.
- US Equities The S&P 500 Index was down =6.94%, with an intra-quarter maximum peak-trough loss of -12.25%. From my perspective, this “blowing off steam” was long overdue with the August decline breaking the third longest-run on record without a 10% correction.
- US Bonds The Barclays Aggregate Bond Index, a benchmark used widely to assess the overall US bond market, was up +1.23%. Personally, I was somewhat surprised that the index didn’t move up more given the typical inverse relationship between stocks and bonds during stock market sell-offs. However, this was likely due to the specter of higher interest rates, with the Federal Reserve Open Market Committee Meeting looming in early September.
- International Equity Markets International markets fared worse than US equity markets, with the Morgan Stanley Capital Index (MSCI) Europe Asia Far East (EAFE) Index down -8.98%.
- Emerging Equity Markets Emerging markets, as represented by the MSCI Emerging Market ETF, was down -11.69% on the quarter, continuing to suffer the fall-out from China’s equity substantial equity market decline, with the iShares China ETF declining 36.29% since peaking in late April.
- Commodities Gold and Oil continued their decline. Gold, as represented by the SPDR Gold ETF continued its slide, down -4.90% for the quarter. Oil, as represented by the United States Brent Oil ETF lost an additional whopping -26.26% for the period.
So, you know the S&P 500 Index recently experienced a “death cross.” Can you guess which of the other asset classes above have experienced a similar pattern?
Answer: All of them! Yes, all of the major asset classes have experienced a “death cross” over the past year.
But, does that mean that you should put your money under the mattress?
While caution is warranted, and a reduction market exposure may be justifiable, moving to a money market fund is likely not the answer given the following.
Additionally, it’s important to note that not all “death crosses” are created equal. In order to not get bogged down, I am going to focus just on the “death cross” in the S&P 500 Index.
- August 2011 The last time the death cross occurred in the S&P 500 Index was in August 2011, when investors were very worried about the prospects of global growth. The market stumbled a total of just under 20%, with just -6.74% occurring after the cross. After stabilizing – with signs that global growth was indeed intact – the market continued its uptrend, with the death cross reversing to illustrate this more positive trend.
- December 2007 The opposite was true in December 2007, when the cross would have resulted in just a -4.31% loss, rather than the nearly 57% decline in the S&P 500 Index through March 9, 2008.
The clear difference between these two examples is what subsequently occurred to the global economy and earnings. In the first case, constructive fundamentals re-asserted themselves, propelling the stock market higher; in the latter, the fundamentals continued to deteriorate, ultimately resulting in the “great recession” of 2008/2009.
We acknowledge that US economic activity has slowed, reinforced by last Friday’s employment report showing that employment increased by only 142,000 jobs in September, well below expectations of more than 200,000/, as well as a stagnation in company earnings. And the steep declines in commodities has certainly contributed to a global slow down, as has the slowing demand from China and other developing economies.
In spite of this, we still see the glass as half-full. European and Japanese company earnings have continued to grow. Additionally, assuming that energy prices stabilize, the Federal Reserve decides to delay raising interest rates until signs of more robust economic growth appear, and the US dollar weakens, making our exports to other countries cheaper, we believe that we are not entering into a bear market.
This doesn’t mean, however, that we won’t see the probability of continued market volatility. And it doesn’t discount the importance of continuing to watch for ongoing price deterioration (continuation of the death cross pattern). Additionally, as mentioned, while we do not use the 50 Day/200 day moving average cross to guide our investment decisions, our computer models have signaled a significant reduction exposure to global equity markets.
In closing, we believe technical analysis is a good tool for guiding investment decisions. However, the markets over the long run by fundamentals, not technical. If confidence in the global growth story resumes, our models will indicate such, and we will take action accordingly. In the meantime, as is typically is the case with the markets, patience is a virtue!
Want to learn more? Join the conversation.
Be well,
Roberta
*Moving Average The simple moving average of a security or index is calculated by adding up the closing price for the security over a particular period (for example, 50 days or 200 days), then dividing it by the number of days in the period. The objective of creating a moving average is to show the price trend of the underlying security.

Alexis Advisors, LLC is a Registered Investment Advisor with the Commonwealth of Virginia. Information contained herein is for informational purposes only and is subject to various interpretations and timeframes, and should not be considered investment advice. Please contact Advisor promptly if there are any changes in your financial situation or investment objectives, or if you wish to impose, add or modify any reasonable restrictions to the management of your account. Since the confidentiality of internet email cannot be guaranteed, do not include private or confidential information such as passwords, account numbers, or social security numbers. Additionally, instructions having financial consequences such as trade orders, fund transfers, etc. should not be included in your email communications, as we cannot act on unconfirmed instructions received via email. Nothing in this transmission should be construed as an offer or solicitation to purchase or sell securities. Investments in securities and insurance products are not FDIC insured, not bank guaranteed, and may lose value. Advisor’s current Disclosure Brochure is set forth on Form ADV Part 2 and is available for your review upon request.