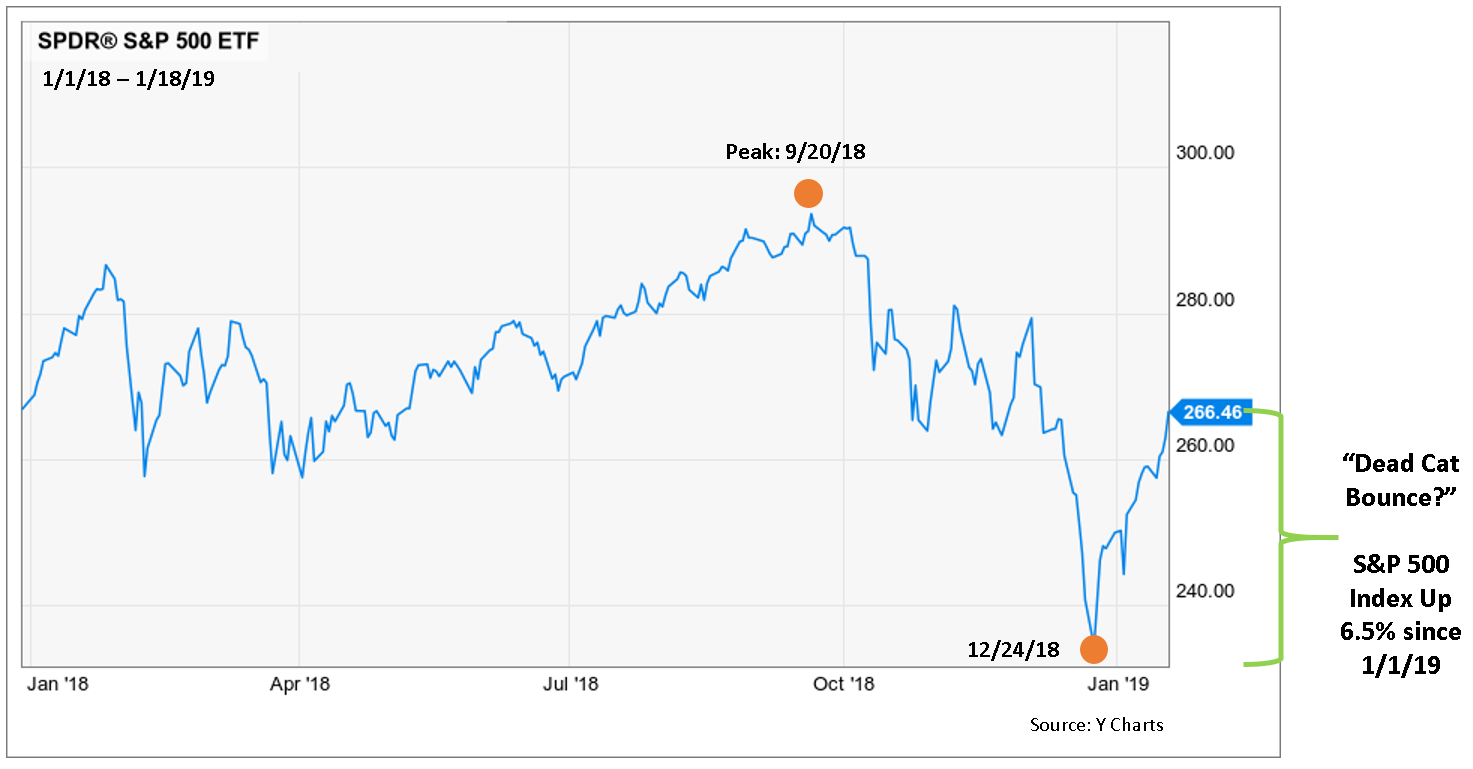
A “dead cat bounce” is a temporary recovery from a decline in equity markets. Downtrends are interrupted by brief periods of recovery — small rallies — when prices temporarily rise. The term is based on the notion that even a dead cat will bounce if it falls far and fast enough.
I know – it’s a terrible analogy, especially for cat lovers like myself. But it’s a well-known term in the industry, and likely apropos to what has been occurring in equities over the past few weeks.
Are we really in a bear market?
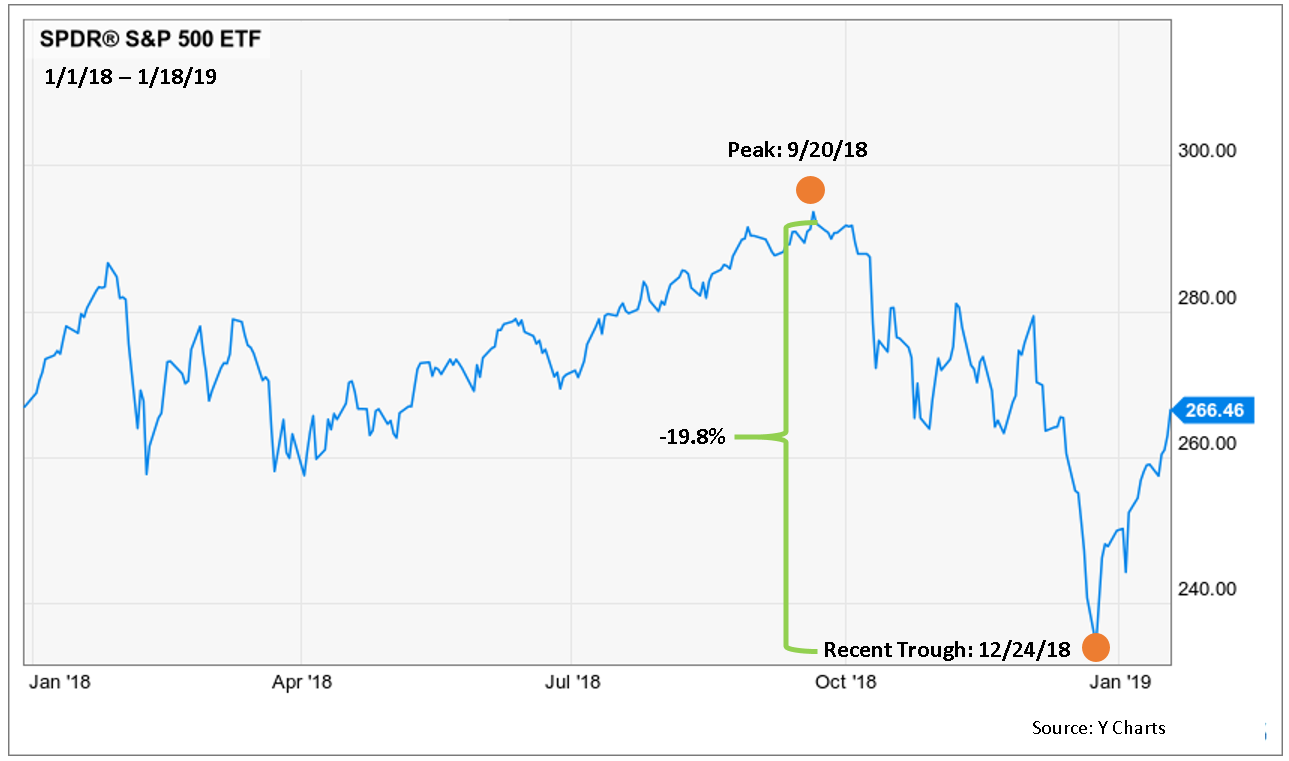
A bear market is defined as a -20% loss in the major indices. For the purpose of our discussion, I am focusing on the S&P 500 Index.
Many may not even be aware that we are in a bear market. It snuck up on us over the holidays – and it was swift and acute. The S&P 500 Index was down just a hair under -20% in just over three months (see chart below).

This, coupled with the strong price action since January 1, may have many investors thinking we are “back to normal.”

We think otherwise. We believe that we are currently just seeing a “dead cat bounce” and that market conditions may get worse before they get better.
There are plenty of headwinds and potential triggers for another sell-off:
· U.S. Government Shutdown As of January 12, 2019, we are experiencing the longest government shutdown in history. Though tough to quantify, some believe this, coupled with an already cooling economy, may tip the economy into recession.
· Earnings Disappointment Earnings season is just beginning. Any disappointment in corporate earnings could be the catalyst for renewed selling.
· Struggling International Economies While currency pressures have marginally eased over the past few weeks, international economies continue to be fragile. The British exit from the European Union (EU) is a mess, with Parliament recently rejecting Teresa May’s EU withdrawal agreement. China’s economy is slowing significantly, which will likely impact other global economies. Japan’s scheduled hike in sales tax from 8% to 10% in October 2019 will likely have a negative impact on consumer spending.
While stock markets don’t respond well to recessions, barring any catastrophic event, we do not think we are entering another -50%-plus bear market. Typically, these are event-driven. For example, the bear market of March 2000 – March 2003 was triggered by the technology price bubble bursting; the bear market of October 2007 – March 2009 was triggered by the Financial Crisis.
How will we know when the current bear market is over?
This is a tough question, but there is typically a noticeable bottoming process:
- Massive Capitulation We would expect to see much higher pessimism, with more pronounced selling. (Think a chicken little, “the sky is falling” scenario.)
- Higher Volatility Index (VIX) The VIX, sometimes known as “the fear gauge,” has not reached levels that indicate a bottom is in place. In the past seven bear market bottoms, the VIX has reached significantly higher levels that what we have seen over the past few months.
- Multiple Indicator Confirmation Money management is not easy. And no one technical indicator is perfect. We lean heavily on Ned Davis Research and assess multiple indicators for confirmation that the uptrend has resumed.
What do we expect for the rest of the year?
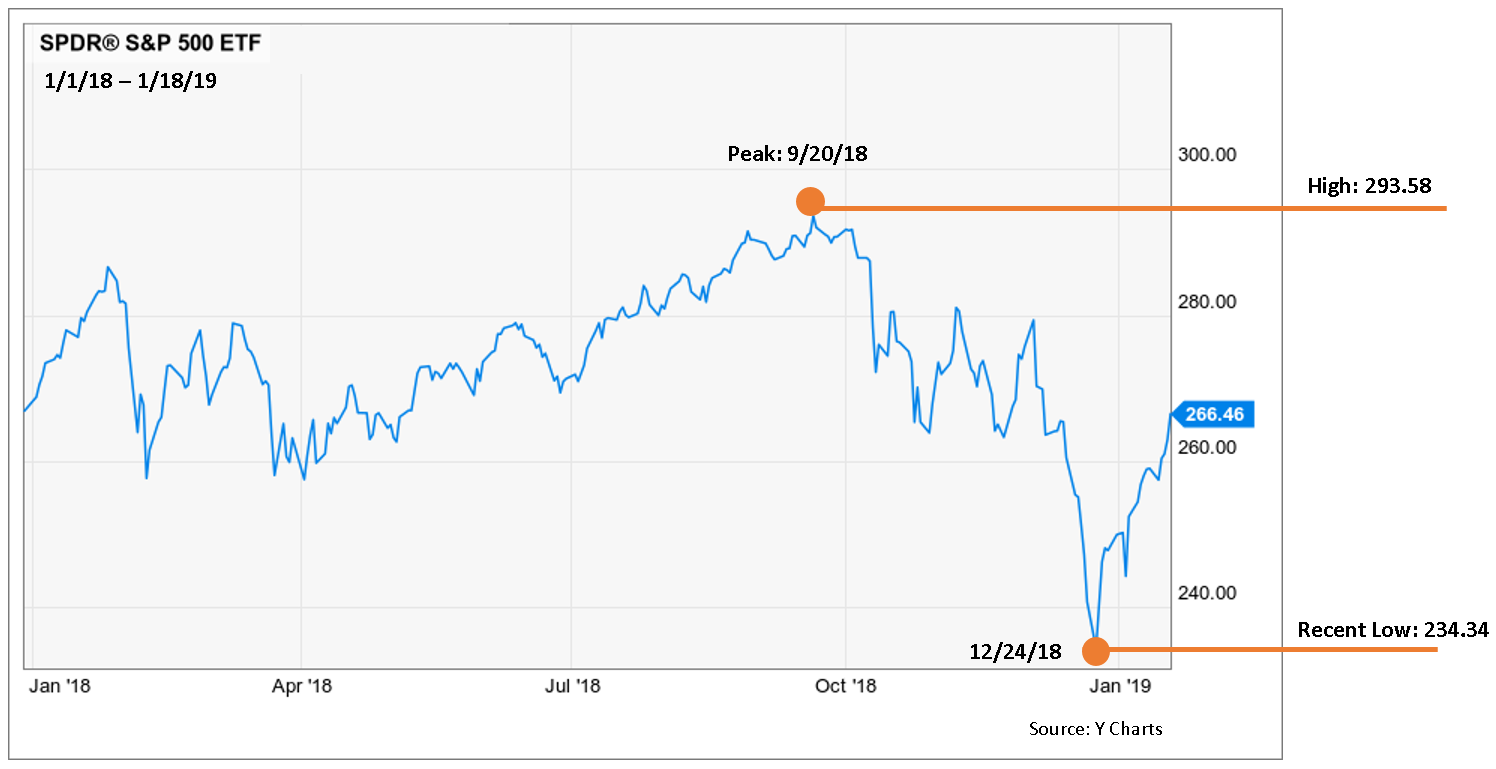
We may see a bottom as soon as March or April of this year, followed by a recovery, with a potential resumption of weakness into the second half of the year – particularly if data shows US economic growth is worse than expected. Our best guess is that the S&P 500 Index will at least sell off to the lows seen on 12/14/18, and perhaps lower. And we expect that we will likely end the year just above highs reached in September of 2018 – so the S&P 500 ETF around 300 (see chart below.)

How are we positioned?
As our clients know, we use varying types of risk controls within our own trading models, one of which is simply to exit positions when market conditions are not healthy.
We categorize all of our portfolios into “offensive,” which are more aggressive, and “defensive,” which are more conservative and less volatile.
- Offensive Portfolios All of our offensive portfolios have all issued a “sell signal,” so each is invested in equities at 50%, with the balance being in a stable value ETF. (Our “offensive” portfolios’ equity investment can range from 50% – 100%, depending on market conditions.)
- Defensive Portfolios Both have issued a “sell signal,” with our Risk Managed Portfolio being invested 15% in equities and our Dynamic Balanced Portfolio invested 0% in equities. (Our “defensive” portfolios’ equity investment can range from 0% – 100%, depending on market conditions.)
We believe that managing risk may be a cornerstone to building wealth over time. If you would like us to review the risk management strategies applied across your accounts, we offer a complimentary review. Don’t hesitate to reach out if we can assist.
The information contained herein is not intended to be viewed as investment advice.
