
For 2016, the most popular averages ended the quarter almost where they started – the S&P 500 cash index was up +0.8, the Dow Jones Industrial Average added +1.5%, and the small-cap Russell 2000 slipped -1.9%.But this “point-to-point” analysis does not accurately reflect the gyrations that took place during the three-month period: the S&P 500 endured its worst-ever first two weeks of the year, and by mid-February, the benchmark had fallen to a 22 month low.
For nearly a year, the US equity markets – and many other global markets – have experienced quite a bit of volatility, but very few “big trends.” “Big trends” are often where “real money” is made . . . or lost. We are always looking for the “big trends.” What exactly are they, and what are their potential implications?
A “big trend” can mean different things to different people. A lot depends on the investment time frame – that is, is the money manager a day trader, or a longer-term investor? In our case, we are typically seeking to identify bull market trends that are greater than one year, and bear market trends that are often greater than three to six months – in other words, those trends that may have a significant impact on our clients’ ability to reach their goals.
When gains (or losses) are realized over a short time period, we tend to view this as “volatility.” For example, gold’s +15% move that occurred over the first six weeks of Quarter 1 (Q1). If the trend persists through the rest of the year, then from our perspective, this begins to have the look and feel of a “big trend.”
Over the past quarter, we continued to experience volatility, but no substantial “big trends,” making for a very challenging investment environment. After falling -5.1% in January, -0.4% in February, the S&P 500 Index reversed sharply in March, +6.6%. A couple of things likely drove this reversal:
- After falling nearly 80% since peaking in September 2013 (yes, you read that correctly!), oil prices, as represented by the United States Oil exchange traded fund (ETF), began to marginally stabilize in mid-February, lending some confidence to the equity markets.
- We entered the year with the expectation that the Federal Reserve would raise rates four times in 2016. However, Chair Janet Yellen’s more dovish stance in February and March let support to the market.
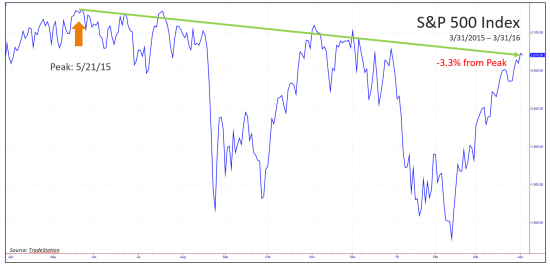
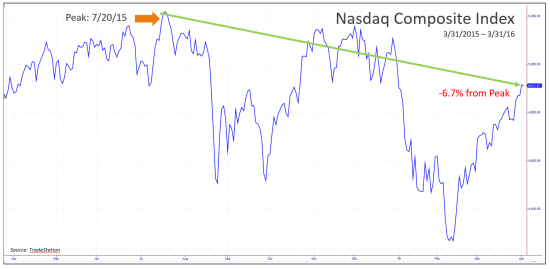
In spite of the more positive equity price action during March, major equity indices still finished the quarter below the peaks reached during the summer of 2015. Two examples are as follows:
Other market ended the quarter as follows:

What’s Next?
Is this kind of volatile market (versus trending market) here to stay for the rest of the year? We expect so, but we feel we are in somewhat uncharted territory – much of what has driven the markets since March 2009 (when many global markets bottomed after the Financial Crisis) is global central bank policy. While central banks have continued with a “friendly” stance regarding monetary policy – that is, lowering or maintaining low interest rates – the impact appears to have become more muted – there is not as much “bang for the buck” when central banks do decide to lower rates. Additionally, markets don’t typically like uncertainty – and right now, uncertainty abounds–ranging from global central bank policy, to company earnings, to whether oil prices will continue to stabilize, to whether Britain will withdraw from the European Union (“the Brexit”), to the U.S. presidential election. Given this uncertainty, many money managers are in a “wait and see” mode – that is, waiting to see how upcoming quarterly earnings shake out, and the potential effect on central bank policy.
Big Trends – Examples
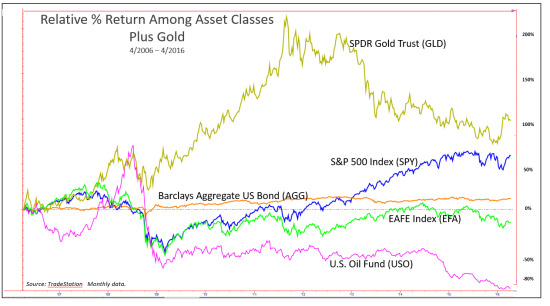
For a few examples of what we consider a “big trend,” take a look at the chart below, which compares the relative return* (right, vertical axis) of the following ETFs over the past 10 years:
- S&P 500 Index (blue line)
- EAFE Index (green) – International (non-US) equity ETF
- U.S. Oil Fund (pink)
- Barclays Aggregate U.S. Bond ETF (orange)

A few observations from a “big trends” perspective:
- Oil During 2008, oil (pink line) spiked sharply. One year is a bit short to classify as a bull market “big trend,” but nonetheless, we would consider this move up a trend, albeit a short one.
- Equities & Oil From late 2007 through early 2009, U.S. equities (blue), international equities (green), and oil (pink) all sold off sharply, with oil falling the hardest given the lofty levels reached in early 2008. On average, bear markets are typically shorter than bull markets, so we would consider these all examples of bear market “big trends.”
- US vs. International Equities Starting in late 2010, U.S. equities (blue) began to outperform international equities (green). From our perspective, from March 2009 – May 2015, US equities represent a nice example of a “big trend.”
- International Equities On the other hand, international equities (green) have experienced no clear trend up or down. In fact, on a relative basis, over the past 10 years, investors would have been better off just investing in the Barclay’s Aggregate Bond Index (orange)!
For an example of what “really big trends” look like, below is the same chart as above, but adding SPDR Gold Trust ETF (gold line.) The performance of gold as represented by this ETF dwarfed the performance of any of the other asset classes displayed . . . until 2011. After peaking in September 2011, as of 12/11/15 (the low for the period displayed) gold lost 45.2% of its value. This puts into context the comment above – that gold was up +15.9% for Q1 2016, doesn’t it?
In Closing
U.S. markets have been volatile over the last year, and based on our definition, with no big trends available. An active investment approach can be challenging during these types of choppy, volatile markets. However, we know that at some point, “big trends” will return. Whether it is a bull or bear “big trend” remains to be seen. Our goal is to strive to apply our models to guide us in identifying these big trends.
For now, we expect more volatility, so patience in the current market environment market is not only a virtue, but a necessity. As such, we are likely in for a bit more of a “waiting game.” However, at some point, things will break, and trending markets will return. Whether that trend is up or down remains to be seen.
As always, give us a call if you would like to discuss this concept further. It’s well worth taking the time to understand!
Be well,
Roberta
* These charts show the relative percentage return of various asset classes. The vertical axis displays the percentage return over or under 0% for the time frame reflected. To assess the return of each asset class, one would need to assess each ETF for the time period reflected. For example, Barclays Aggregate U.S. Bond ETF had a performance of 6.6% for the period reflected.

Alexis Advisors, LLC is a Registered Investment Advisor with the Commonwealth of Virginia. Information contained herein is for informational purposes only and is subject to various interpretations and timeframes, and should not be considered investment advice. Please contact Advisor promptly if there are any changes in your financial situation or investment objectives, or if you wish to impose, add or modify any reasonable restrictions to the management of your account. Since the confidentiality of internet email cannot be guaranteed, do not include private or confidential information such as passwords, account numbers, or social security numbers. Additionally, instructions having financial consequences such as trade orders, fund transfers, etc. should not be included in your email communications, as we cannot act on unconfirmed instructions received via email. Nothing in this transmission should be construed as an offer or solicitation to purchase or sell securities. Investments in securities and insurance products are not FDIC insured, not bank guaranteed, and may lose value. Advisor’s current Disclosure Brochure is set forth on Form ADV Part 2 and is available for your review upon request.