Year-to-Date 2023
August through October are often challenging months for the stock market, which has held true this year, with the markets experiencing a decent bounce last week after the Federal Reserve indicated that it was likely at the end of the rate hike cycle.
Through mid-summer, technology stocks had significantly outperformed the broader market. Since both the S&P 500 and Nasdaq are “capitalization-weighted,” the larger market value technology stocks comprise a larger percentage of the indices, pulling both indices up. As you can see in the chart below (1/1/23 – 10/30/23), technology stocks – specifically the “Magnificent 7” (Apple, Amazon, Google-parent Alphabet, Meta, Microsoft, Nvidia, and Tesla) – were largely responsible for the S&P’s rise during the first half of the year.
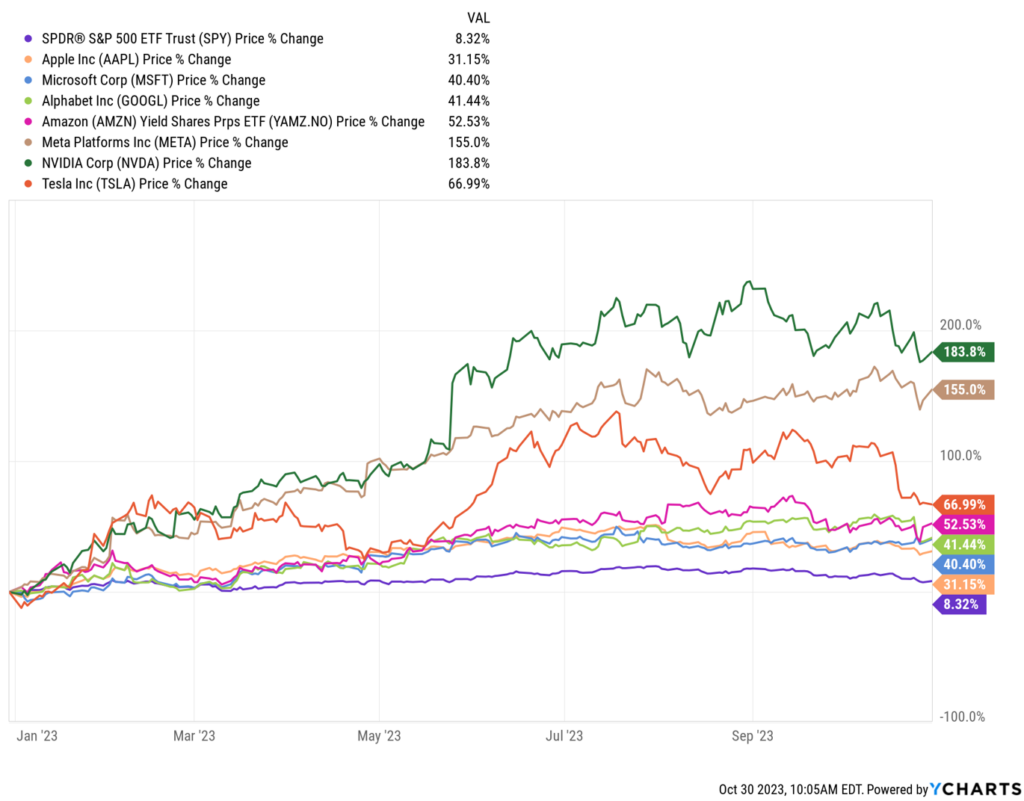
This has been a “stock pickers” market – and specifically a technology stock pickers market – as many other companies in the S&P 500 index didn’t perform nearly as well. To participate in the market rally, you had to be “right stocks” – or at least in the right sector. (Our Equity Growth Portfolio participated in this rally in technology stocks, but we believe in diversification, so don’t just invest in technology companies in this portfolio.)
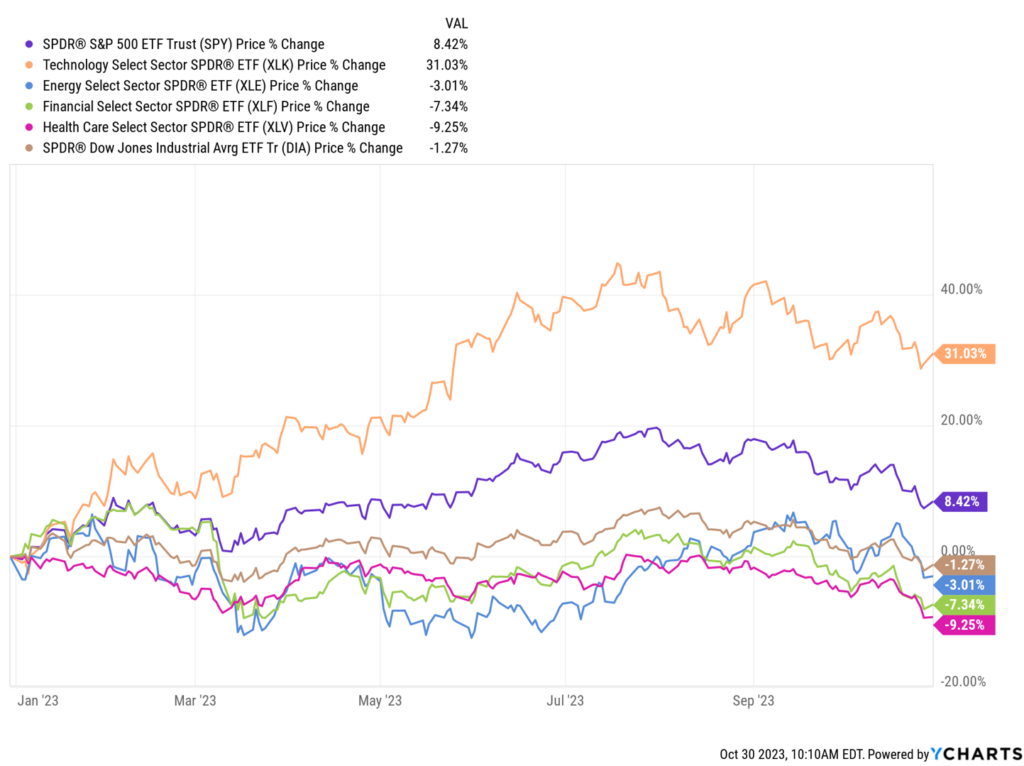
Let me paint a picture. Below is the year-to-date (YTD) performance of the S&P 500 Index (purple line), the Nasdaq Composite (orange line), and four other sector ETFs – Energy (XLE, blue line), Financials (XLF, green line), Healthcare (XLV, pink line), and Industrials (DIA, beige line). As you can see, there is a wide divergence in performance.
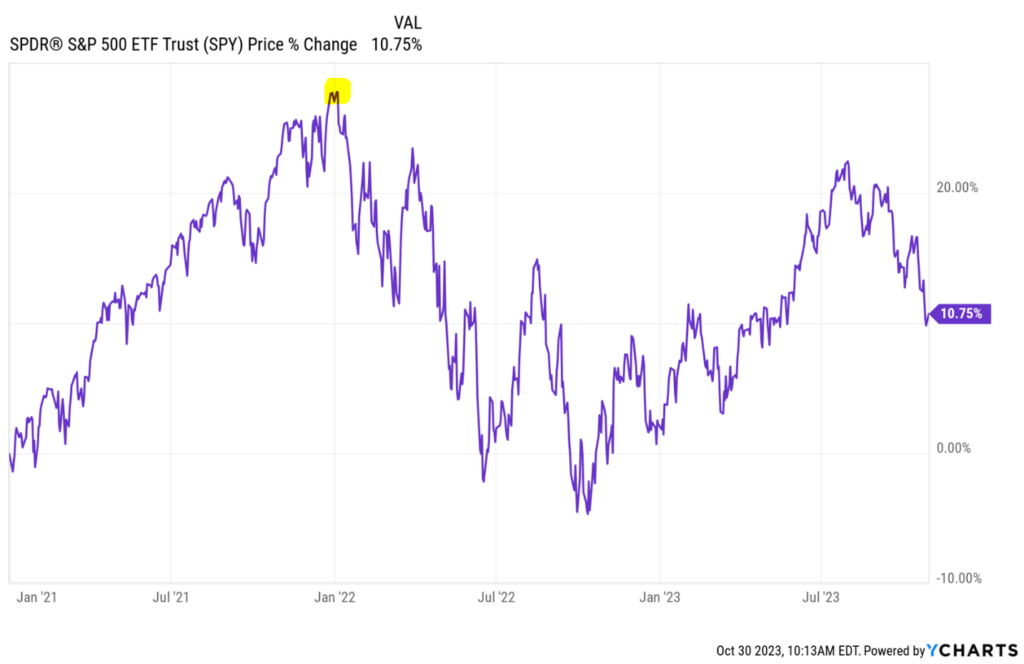
What is not obvious to many is that while we had a strong rally during the first half of the year, we still haven’t regained prior highs. Below is a chart that illustrates the S&P 500 Index from 1/1/21 – 10/30/23. The yellow dot indicates the prior peak, in December 2021 As you can see, starting in Q3 of this year, the index started to sell off before getting back to its 2021 high.
What We Are Watching on the Economic Front
Below are the key items we are watching:
- Israeli/Palestinian War – Putting aside the very real, devastating human cost, the war also has serious economic costs. This war will likely compound several preexisting adverse global trends, including increasing food insecurity, deglobalization, worsening environmental degradation, disruption to normal economic activity, and importantly a rise in debt. The U.S. is supporting two wars, which is expensive on many fronts – and most importantly, the human cost.
- Inflation – Inflation continues to abate – except for food and energy. The chart below illustrates the Consumer Price Index (CPI) as reported by the Bureau of Labor Statistics (BLS). The blue line represents overall inflation, and the red line represents inflation excluding food and energy. Inflation across all items (blue line) jumped higher in August, more than any preceding month this year, likely driven by an increase in oil prices. But the inflation measures not including food and energy (red line) continue to trend down.
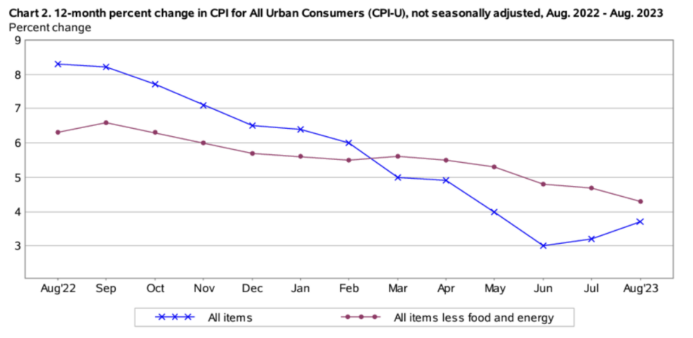
Oil prices recently climbed to over $95 per barrel to their highest in 13 months over concerns that the global market for oil will face supply shortages due to pending production cuts by the Organization of the Petroleum Exporting Countries (OPEC), Saudi Arabia, and Russia. But prices have backed off considerably, to less than $80 per barrel.
- Interest Rates – In Q1 2022, the federal funds rate was close to zero. Since then, the central bank has raised rates 11 times, increasing the Fed Funds rate by more than 5 percentage points. The Fed held interest rates steady in its September meeting but continues to express the possibility of future rate increases. The Fed announced that it is likely at the end of the interest rate tightening cycle, which bodes well for equities – and bond prices. While the Fed wants to see more slack in the labor market (AKA, higher unemployment), there are clear signs that rate increases are having their desired effect.
- Unemployment – Unemployment ticked up slightly to 3.9%, compared to 3.8% in September, but it is still at historically low levels. The Fed doesn’t explicitly say it like this, but a surefire way to crush spending (and inflation) is to raise unemployment.
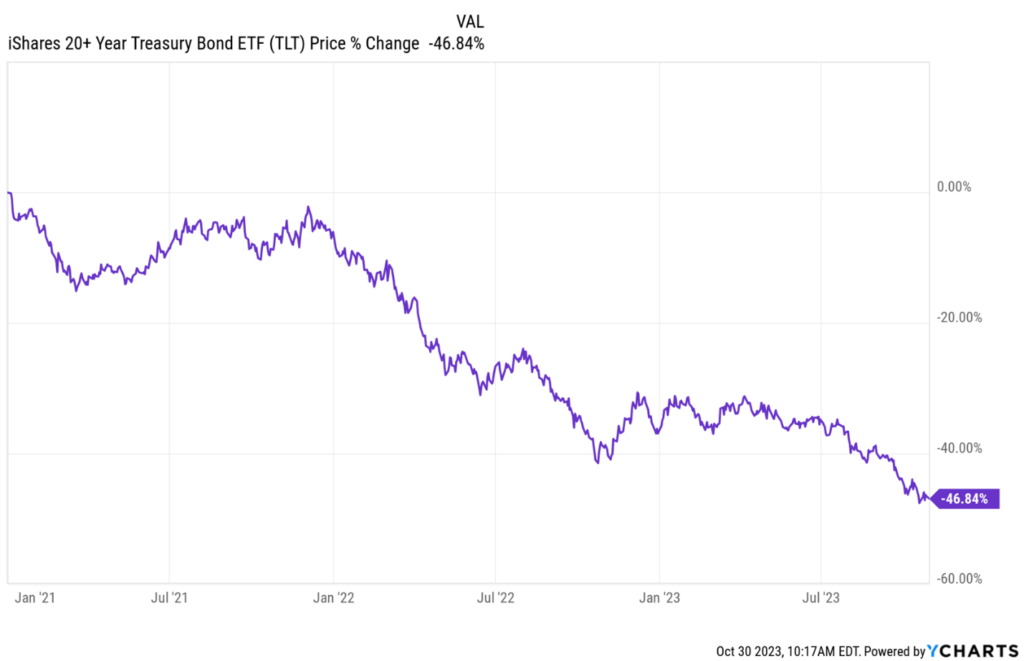
- Government Deficit – Headlining the news over the past few weeks was yet another narrowly avoided government shutdown. The bond market is a great barometer for confidence in U.S. credit. And it’s currently showing chinks in the armor. Below is the price chart of the 20 Year+ Treasury Bond ETF (TLT). Since 12/31/21, it has lost over 40% of its value. Granted, this is one of the most volatile bond ETFs (this ETF includes only bonds that mature in 20+ years) – and the decline has largely been driven by rising interest rates. But another trigger has been the financial mismanagement by Congress. Credit rating agency Fitch Ratings recently downgraded U.S. government debt from AAA to AA+ citing the fact that the government narrowly avoided defaulting on its debt during a June showdown. Standard & Poor’s downgraded our debt in 2011. The third and final credit rating agency Moody’s is the last hold out on its AAA rating but agrees that these down-to-the-wire debt ceiling negotiations reflect poorly on the government’s ability to pay its bills.
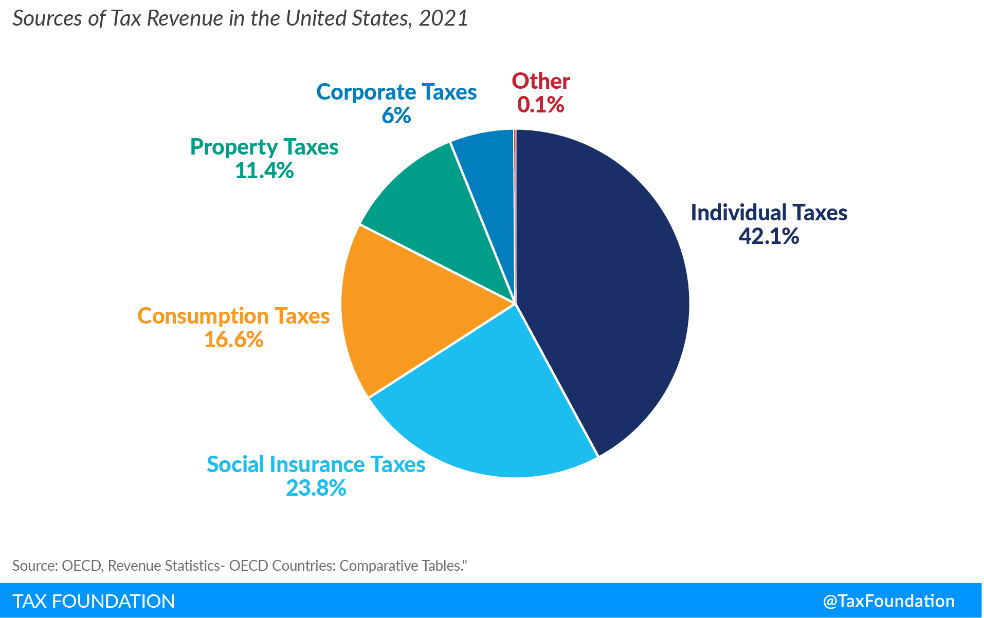
The equation is “simple” – taxes need to go up and spending needs to be cut. This is the eternal push-pull in Congress. We think it needs to be a little bit of both. Spending cuts and an increase in taxes – not on individuals, but on corporations. Below is a chart from the Tax Foundation that illustrates the sources of U.S. tax revenue. Which category seems like it could be paying more of its “fair share?”
What We Expect in the Markets
The situation in the Middle East has certainly caused a great deal of uncertainty – but barring any major energy shocks or expansion of the war to other countries, we don’t think this will have a significant impact on the global economy.
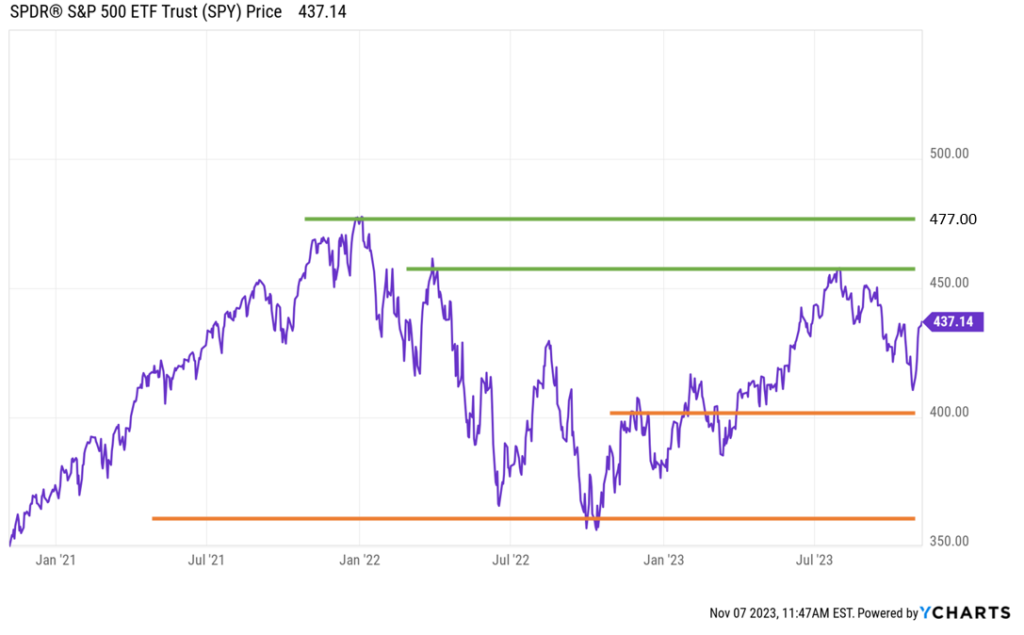
The chart below illustrates the price of the S&P 500 Index over the past 2 years. The two orange lines indicate technical levels that could provide market support – one at the S&P 500 Index ETF level of approximately 400, and another at approximately 357.
The market had a nice rally last week on the Fed interest rate news. If the market continues to stabilize here, we could rally to recent highs of 456. If the market breaks above this level, the natural resistance is at an all-time high of approximately 477.
How are we positioning our proprietary portfolios?
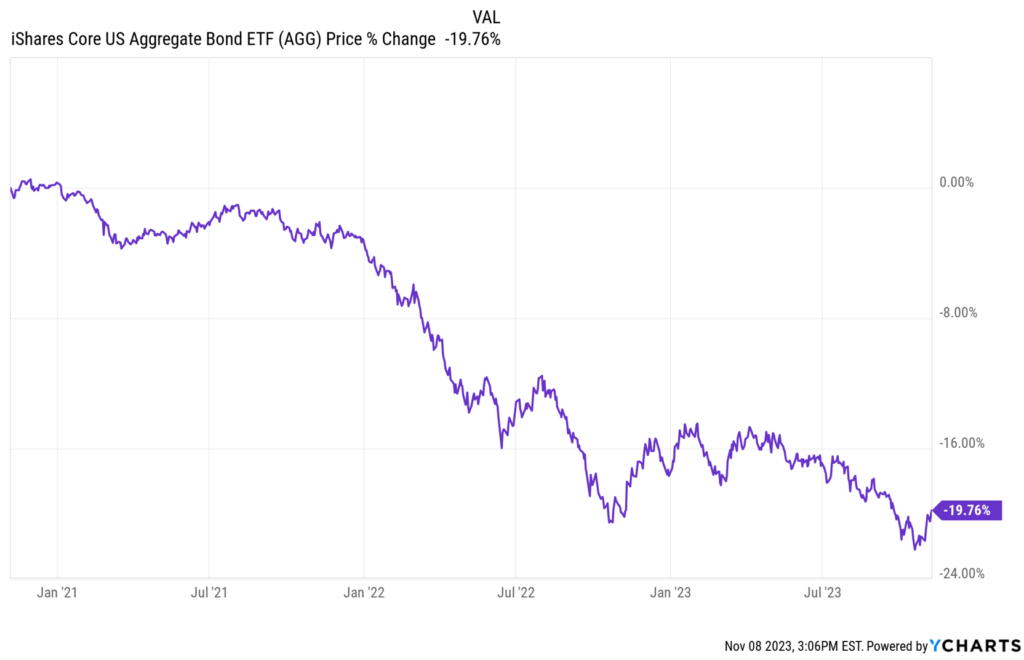
The current cash position in our equity portfolios is approximately 10-15%. And with interest rates stabilizing, we are increasing the duration of our bond portfolios. This means that we are shifting our holdings from short-maturity bond funds to those such as the one below, the iShares Core US Aggregate Bond ETF (AGG), to take advantage of cheaper prices.
If you would like a complimentary review of your investment accounts to assess your risk versus reward, reach out.