Before we get to the “elephant in the room,” let’s recap 2022.

2022 in Review
2022 was challenging on many fronts; the war in Ukraine, increased polarization between world leaders, and policymakers that appeared to be unsure of how to make the right decisions for the future. We have been living through unprecedented times with no real blueprint to follow from our lifetime.
Financial markets were also very tough to navigate:
- Interest rates were up a lot. The Fed raised rates seven times, for a total of 4.25%).
- Equities were down a lot. The Nasdaq 100 (QQQ) was down -33.07%, and the S&P 500 Index (SPY) down -19.48%, and the Europe, Austral Asia Far East Index (EFA) down -16.57%.
- Bonds were down a lot. Bonds as represented by the iShares Core US Aggregate Bond (AGG) down nearly -15% and the iShares 20+ Year Treasury bond ETF (TLT) down a whopping -32.82%!
Equity and bond market movements can almost be completely boiled down to the actions of the Federal Reserve (the “Fed”). While inflation marginally dropped during Q4, the Fed continued to navigate the current economic climate of high inflation. The Fed’s directives were clear – to maintain the federal funds rate in a target range of 4.25-4.50%, indicating that rates would stay higher for a protracted period of time.
For the first time in many of our lives, bond prices declined precipitously. We met with many prospects who had been negatively impacted by their bond investments, and who were left asking “why is my account down so much given my high bond allocations?” This question is understandable. Since the early 1980’s bond prices have, for the most part, gone up. Investors have gotten accustomed to their bond allocations being steady, and even making money. But with the aggressive rise in interest rates, many bond funds declined, essentially resulting in bond allocations not offsetting equity losses and rather, compounding them.
So, most asset classes suffered – with a couple of exceptions – commodities and the U.S. dollar. I am happy to discuss these, but for the sake of not making this blog an epistle, I am going to move on to the elephant in the room.
2023 Preview
While there is no expectation that the equity or bond markets will rescue the economy in 2023, we think that there is a glimmer of light at the end of the tunnel – assuming a deep recession can be avoided and the debt situation can be remedied.
Recession: Inflation appears to be abating, so the big question now on everyone’s mind is “Are we headed into a recession?”
The stalwarts of the technology sector (Amazon, Microsoft, Google) have already announced meaningful layoffs – over 70,000 employees over the last year – driven by slowing growth and fears of recession. These concerns are reflected in technology stock prices, many of which were down over 30% last year – even the really strong companies. (While we are still in “wait and see mode”, we have cash (“dry powder”) to invest. We aim to buy strong companies, and are particularly happy to do so at lower prices, which is why having some cash on the sidelines may be an important consideration.)
As mentioned, the Fed has indicated that its primary goal is to reduce inflation, even if it means pushing the economy into recession. If the Fed wins the battle and the war, companies could continue to lay off more workers, which in turn would slow the economy given lower consumer spending. However, we think that if there is a US recession, it will likely be short-lived given that the “U.S. patient” (meaning America) went into the operating room fairly fit – and certainly more so than its European counterparts.
National Debt: With the markets, anything is possible. Much can go right…or wrong. Some triggers for market declines are hard to understand, while others are less so.
I watch Bloomberg daily and while I think they are hands down the most capable market media outlet, it amuses me to listen to the newscasters trying to provide a logical reason for the daily market movements. It’s a tough business – and some moves are just not logical, driven by fear, greed… and computer programs. Some drivers are rarely discussed because they are very complex – for example, options expirations, a price hitting an important technical price level resulting in options being exercised, or program trades kicking in.
But some triggers for market declines have historical data to back them up, with high debt levels being one potential. (If interested in taking a deep dive into market history, I suggest reading It’s Different This Time: Eight Centuries of Financial Folly. This book provides a fascinating analysis of the varieties of financial crises and guides one through eight astonishing centuries of government defaults, banking panics, and inflationary spikes—many of which were driven by too much debt.)
This is the elephant in the room. Current debt levels intersecting with high interest rates.
We don’t see all debt as “bad” – it is a necessary tool for all levels of government (cities, states, and federal) and corporations to finance their programs and projects. However, at 79% of our Gross Domestic Product (GDP), our national debt is at its highest point since just after World War II. And unfortunately, we are experiencing this at the same time we are experiencing much higher interest rates, resulting in a higher price tag to finance the debt.
Let me provide an example that you can likely relate to. A few years ago, when interest rates were low, you may have only been paying 10% interest on your credit card. Today, interest rates are closer to 20%. Let’s say you keep a balance of $1,000 on your card – a 10% annual percentage rate (APR) means you pay $100 to finance the loan. Today, given the rise in interest rates, you may be paying closer to a 20% APR, and as a result, paying $200 to finance your debt. This makes it tougher to pay off your debt because of the financing costs.
As you are likely aware, there is a big fight going on in Congress around raising the debt ceiling. The debt ceiling is a restriction imposed by Congress on the amount of outstanding national debt that the federal government can have. (This is like the cap on your credit card, known as your credit limit.) Once the debt ceiling is reached, the federal government cannot increase the amount of outstanding debt, losing the ability to pay bills and fund programs and services.
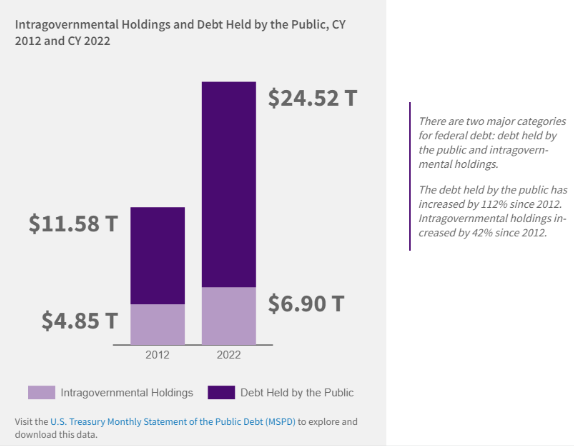
It’s important to consider that the national debt is comprised of distinct types of debt, similar to individuals who have different types of debt – credit cards, a mortgage, a car loan. We often hear about the need to reduce financing of Medicare, Social Security, etc. but over the past decade, the biggest contributor to the national debt increase hasn’t been these types of programs (Intragovernmental Debt), it’s been Public Debt.
The chart below tells the story, comparing the growth in debt levels for 2012 and 2022 between these two primary categories of debt: Intergovernmental Debt and Public Debt. While both types of debt combine to make up the national debt, as you can see, they have increased by very different amounts in the past several years.*
- Public Debt: Public Debt is the federal debt held by individuals, corporations, state or local governments, Federal Reserve Banks, foreign governments, and other entities outside the United States Government. One of the primary causes of the jump in Public Debt over the past decade is attributed to increased funding of programs and services during the COVID-19 pandemic.
- Intragovernmental Debt: This has not increased by nearly as much. This type of debt includes debt owed on agencies’ excess revenue invested with the Treasury. The revenue of the largest investor in Treasury securities – the Social Security Administration – has not increased significantly in recent years, resulting in this slower Intragovernmental Debt increase.*
As mentioned, the fly in the ointment is the current intersection between these higher debt levels and higher interest rates. When this Public Debt was accumulating as a result of the pandemic, interest rates were near historic lows, so financing the debt wasn’t an issue. However, recent increases in interest rates are now resulting in a substantial increase in the cost of financing the debt. As of December 2022, it costs $210 billion to finance the debt, which is 15% of the total federal spending.*
The cost of financing can be addressed in a couple of ways – lowering interest rates or reducing the debt, particularly the Public Debt. We do not think that the U.S. will default on its debt payments – the impact would be just too great, and our legislators know this. And as we have seen over the past week or so, the Treasury can use extraordinary measures authorized by Congress to temporarily suspend certain intragovernmental debt allowing it to borrow to fund programs or services for a limited amount of time after it has reached the ceiling.
But the current course needs to be corrected. Inflation appears to be coming down due to the Fed’s aggressive interest rate hikes, but the Fed has stressed that we should expect rates to remain higher for longer. So, we need a “fix” for Public Debt. And this means Congress needs to learn to step up to the plate, collaborate and compromise.
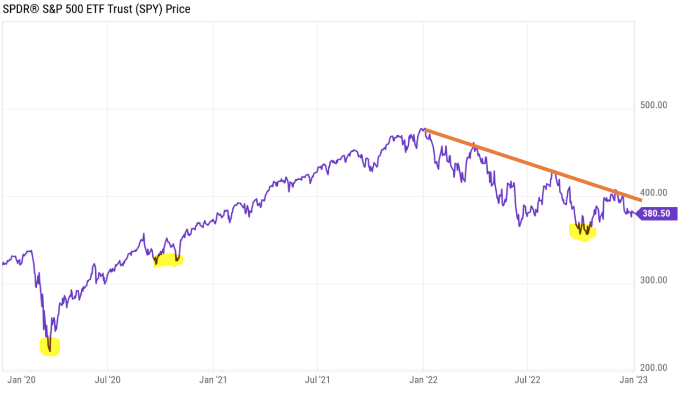
US Equities: There are many opposing viewpoints on what’s to come in 2023. Some believe that equity markets bottomed in June of last year, while others see more pain to come— re-testing the June lows, and possibly declining further (see chart below.)
In this kind of environment, we tend to lean heavily on technical analysis to assess the overall “tone of the market.”
Below is a chart of the S&P 500 Index ETF from 1/1/2020 – 1/3/23. The orange line is what’s called a “trend line.” We are clearly in a downtrend and continue to be officially in a bear market, defined as -20% or more. Until we can break above this trend line, we believe the market will continue to struggle. We may return to the lows of June 2022 (yellow highlight on the right), or lower (other yellow highlights). Or if we break above the trend line we may get a nice rally – but likely not above the highs of December 2021. We strive to be prepared for either eventuality – a price break above the orange line, or a price break down.
Bonds: Assuming the Federal Reserve tapers off its interest rate increases – which we expect will be the case – we believe bonds may be a bright spot for investors. We are currently considering which parts of the bond market in which to invest.
So, what do we expect? Likely more volatility in equities during the first half of the year, in particular. We don’t expect a default of the U.S. government. And we do expect that bonds may provide a silver lining.
Can we help you assess your bond investments? Or your investments in general? Reach out. We’d love to help!
Roberta
* Source: Fiscal Data – Treasury.gov