The U.S. equity market had no respect for the adage, “sell in May and go away,” with the S&P 500 Index ending up 4.65% for the second quarter (Q2) 2014. As is often the case with the market, it had the last laugh, with the S&P 500 Index breaking out to new highs right after moving into what is often called “the unfavorable season” – the months between May and October where the market tends to exhibit the greatest volatility. The S&P 500 Index reached these new highs in spite of this bull market being the third longest lasting in history:
- The 1920’s bull market lasted nearly nine years (with a short correction from 3/1923 to 10/1923) – before the Dow Jones Industrial Average collapsed nearly -90%.
- The 1990’s bull market lasted almost ten years (with a short, sharp correction in the summer of 1998) thanks to the evolution of the “tech economy” – before the S&P 500 Index plunged -49% (and the NASDAQ lost -78% of its value) from 3/2000 to 10/2002.
- The bull market from 10/2002-10/2007 lasted five years – before the S&P 500 sold off nearly -57% from 10/2007 to 3/2009, thanks to the bursting of the real estate bubble, and ensuing financial crisis.
The current bull market is now over 5.3 years old, again making it one of the longest in history. Does this mean that we are about to have another bear market like those listed above?
Why Cycles Matter
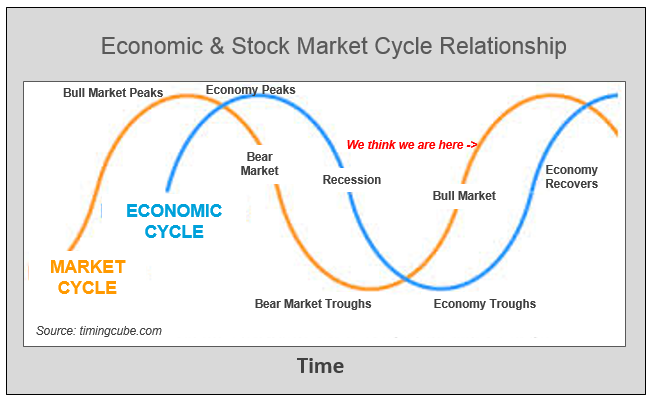
The economy – and the equity markets – are included to exhibit cycles and patterns. The stock market tends to “lead” the economic cycle – that is, a bear market will typically start before the economy moves into recession, and a bull market will typically lead the economy out of recession (see below):
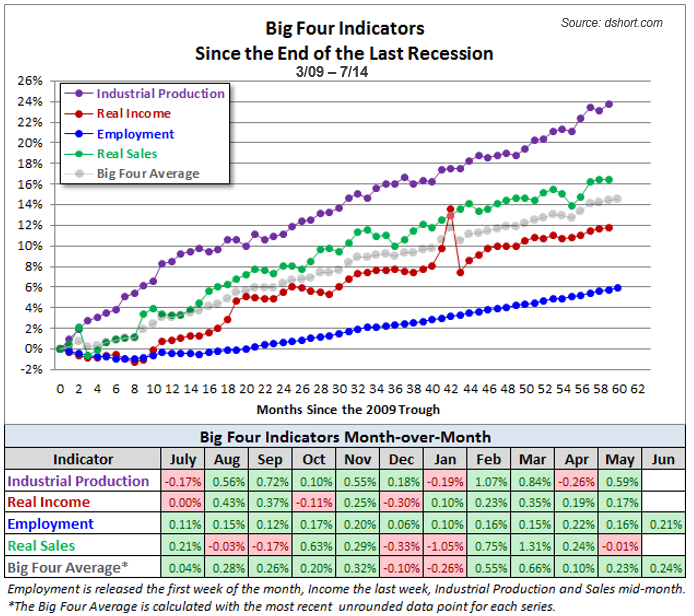
While some of the economic data has been mixed – particularly housing data – “The Big Four Indicators” (as coined by Doug Short) have continued to turn in solid results, with little to indicate that we are about to enter a recession.
Additionally, from a 30,000 foot view, S&P 500 company earnings are growing nicely, with Q2 2014 earnings growth expected to be +4.9% (Reuters estimate) to +6.2% (Markit estimate), and Q3 and Q4 2014 earnings growth expected to continue to accelerate.
So, from a fundamental perspective, the market should be on fairly solid ground, right? Well, there are some market characteristics that are giving us pause over the short term:
- Low Volatility Low volatility (small price swings) in the market typically indicates rising prices. This is, of course, a good thing – unless the volatility has been so low, for so long, that the probability of greater price swings is relatively high. Volatility (as represented by the VIX, the Volatility Index), recently fell to its lowest level since February, 2007. The question on many money managers’ minds is “how long can these levels be sustained?” If history is a guide, then not indefinitely.
- Valuation Valuations, as measured by the Price-to-Earnings ratio of the S&P 500 companies, is still relatively high – just above 19.5. The Index’s P/E in 2000 and 2007 was at similar levels.
- Extended Advance The S&P 500 has advanced for approximately three years without a 10% correction, and for more than 5 years without a 20% setback – both of which, from an historical perspective, is fairly rare.
- Crowd Sentiment Crowd sentiment –that is, investors’ view on market opportunities – has reached extreme levels. As you can see from the scorebox in the lower left corner of the chart below, extreme optimism is typically bearish, with the S&P 500 Index tending to move lower when optimism is running this high. Like most aspects of the market, an equilibrium is sought – when prices, sentiment, valuations, etc. get too high or too low, the market strives to correct these imbalances…over time, of course.

What could trigger a sell off? Certainly, geopolitical events could tip the scales, knocking the market off of its lofty perch – the unrest in Ukraine, the posturing by Putin, or another spike in oil prices instigated by the circumstance in Iraq.
However, assuming none of these – or other unforeseen events – tip us back into recession, we don’t see the US equity markets entering a bear market like those listed in the beginning of this article. That said, we do see volatility likely increasing over the summer months and/or into the early fall.
Market valuations, sentiment and other factors can stay stretched for months, or even years. So while we assess the above type of data on a daily and/or weekly basis, we don’t typically use this to make investment decisions. Rather, we rely on our models, which primarily focus on the market’s price action, to help us discern “what the market is doing, rather than what we think it should be doing.”
There have been 11 business cycles from 1945 to 2009, with the average length of a cycle lasting about 69 months, or a little less than six years (Source: NEBR). We are just over 5 years into the current cycle, and don’t think it’s coming to an end yet. We do, however, think the potential risk-versus-reward in the market warrants caution over the coming weeks, which is reflected by the positioning in our portfolios.
If you would like to learn more about our investment approach or our portfolios, we encourage you to contact us and join the conversation.

Information contained herein is for informational purposes only and is subject to various interpretations and time-frames, and should not be considered investment advice. Advice may only be provided after entering into an advisory agreement with Alexis Advisors, LLC (“Advisor.”) Advisor does not assume any legal liability or responsibility for any incorrect, misleading or altered information contained herein. Advisor shall not be liable for the improper or incomplete transmission of the information contained in this communication. Past performance is not indicative of future results while changes in any assumptions may have a material effect on projected results. Third Party Research Disclaimer: Third party research is provided for information purposes only and has not been prepared by Alexis Advisors, LLC. The information contained herein is based upon sources which we believe to be reliable, but no representation, express or implied, is made with respect to the accuracy, completeness or reliability of the information or opinions in the reports. About: Alexis Advisors, LLC is a Registered Investment Advisor with the Commonwealth of Virginia. Advisor’s current Disclosure Brochure is set forth on Form ADV Part 2 and is available for your review upon request. Please contact Advisor promptly if there are any changes in your financial situation or investment objectives, or if you wish to impose, add or modify any reasonable restrictions to the management of your account.